Fitness and Health Levels on the Sickness-Wellness-Fitness Continuum
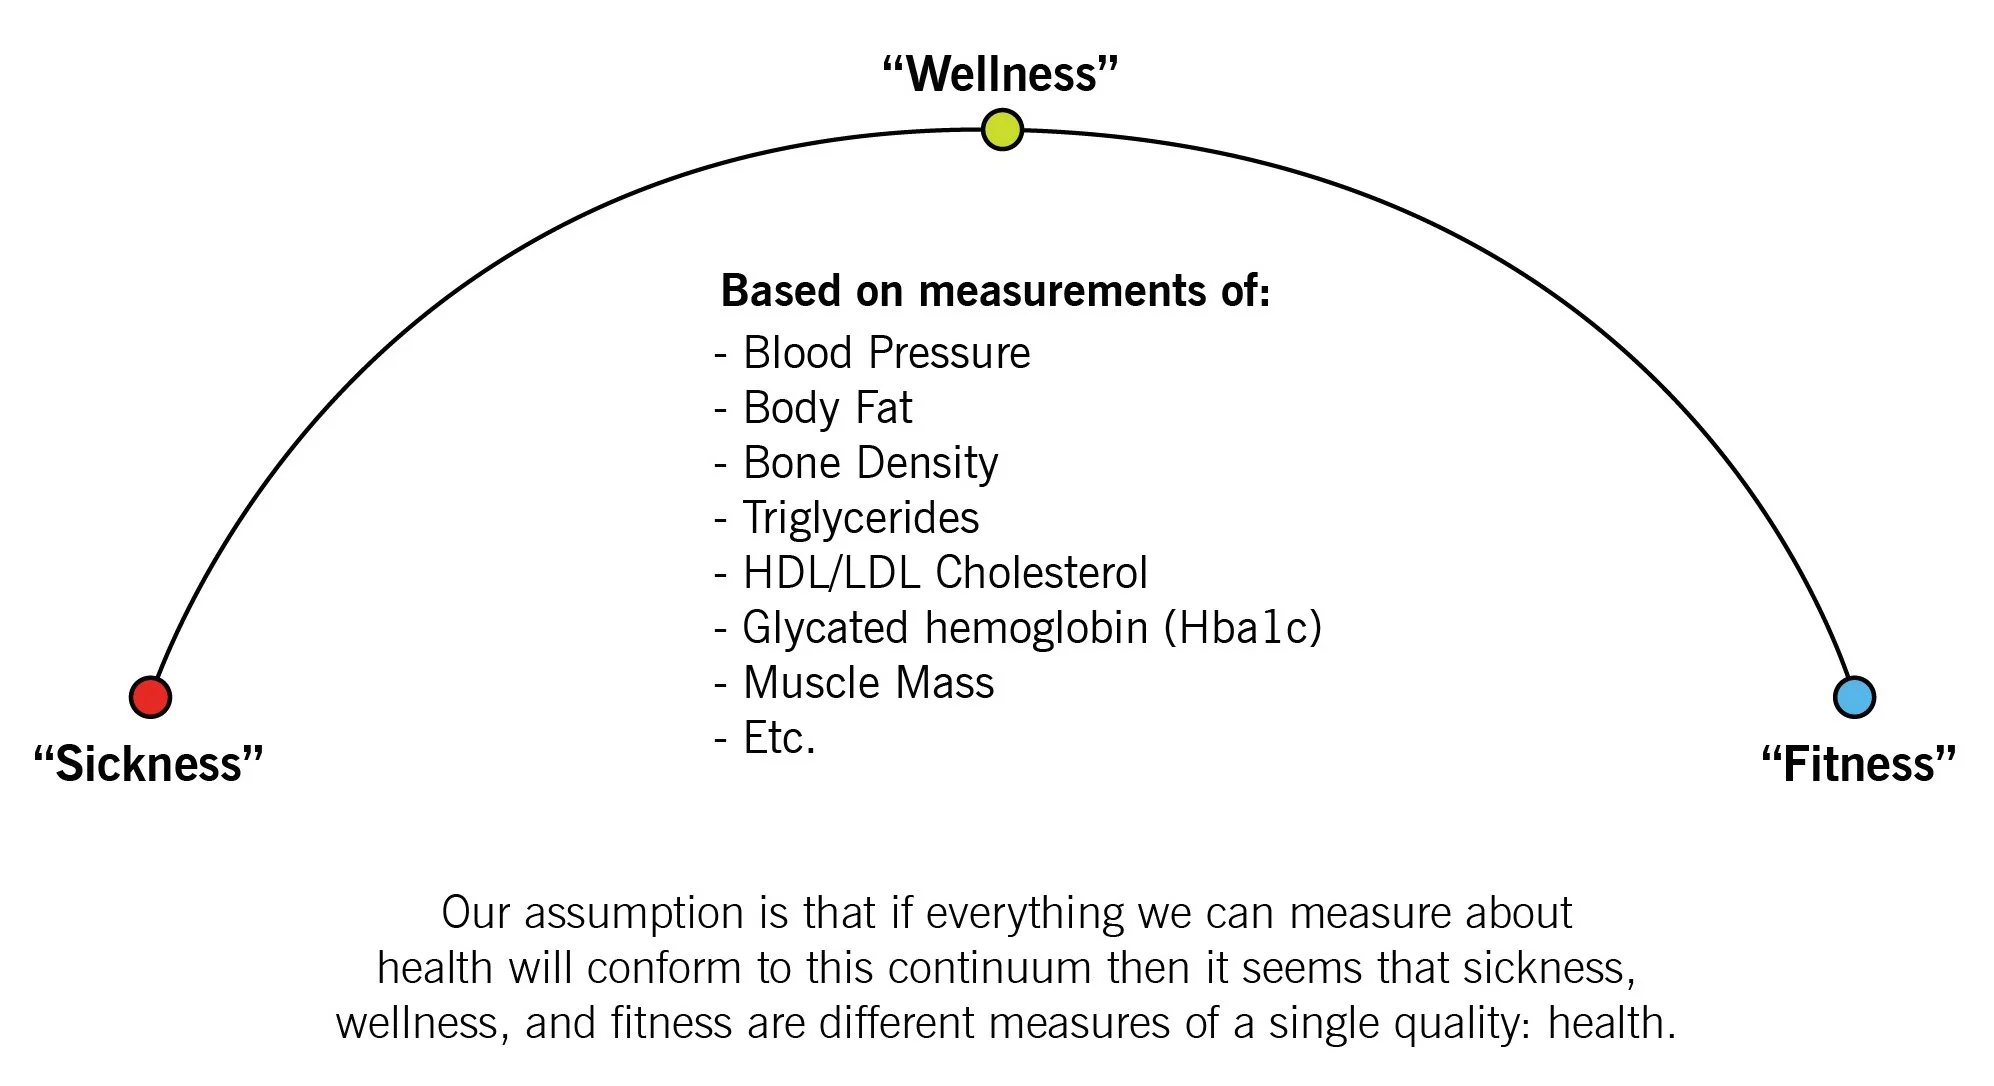
For our 15 Level Method Categories that we Assess, Address, and Progress over time, we see where our Levels for the Categories lie on the continuum from White to Red (White, Yellow, Orange, Blue, Purple, Brown, Black, and Red).
We can overlay the Sickness-Wellness-Fitness Continuum over the Level MAP (Method of Athletic Progression), as the colors White, Yellow, and Orange loosely correlating to Sickness, Blue, Purple, and Brown for Wellness, and Black, and Red for Fitness, respectively.
The more consistently we are eating Meats and Vegetables, Nuts and Seeds, Some Starch, Little Fruit, No Sugar and No Seed Oils, keeping Macronutrient Ratios to support Metabolic Flexibility, and Amounts to support exercise and not body fat, and performing Constantly Varied, Functional Movements at High Intensity, then we should see our Category Levels move to the right on the MAP, where the “higher” colors are, designating us as more Well, and Fit.
We can keep track of our Fitness Performance numbers and benchmarks using the MAP and the 15 Categories as listed below:
Front Squat
Upper Body Pull
Lactic Tolerance (Fran)
Deadlift
Upper Body Push
Upper/Lower Endurance (Diane)
Rings
Weightlifting
Squat Endurance
Neurological and Core Endurance (Annie)
Kettlebell
Flexibility
Running
Rowing
Aerobic Power Intervals (Fight Gone Bad)
In parallel, our health biomarkers, specifically our assays, or tests, we can run on our blood, can show us how Sick, Well, or Fit we are. Like the performance data we can track above in the Level MAP, these certain assays listed below, and the data we collect from them through ordering a phlebotomy and subsequent lab testing, can give us a snapshot in time of our Fitness, as well. Keeping consistent tracking over time of these blood test data can show us our overall Health, which is Fitness over our lifetime.
As we focus on breathing properly in any given situation, getting the right quantity and quality of sleep, hydrating with the right quantity and best quality available, eating whole, unprocessed, high-quality raised, caught/harvested foods in the right amounts and combinations, and training the originally intended methodology of CrossFit and, then we should see our blood test data in the short list of examples like those below, move from the Sick end of the Continuum, or the “Abnormal” or “Pathological” end of the given ranges of clinical diagnostic assays, to the Well section of the Continuum, or the “Normal” part of the given ranges, and eventually to the Fit end of the Continuum, or the “Optimal” end of the given ranges.
Na (Sodium)
K (Potassium)
Cl (Chloride)
Mg (Magnesium)
CO2 (Carbon Dioxide)
BUN (Blood Urea Nitrogen)
hsCRP (High Sensitivity C-Reactive Protein)
Insulin (Fasting)
GLU (Fasting Blood Glucose)
HbA1c (Glycosylated Hemoglobin)
TG (Triglycerides)
HDL (High-Density Lipoprotein)
LDL (Low-Density Lipoprotein)
vLDL (Very Low-Density Lipoprotein)
ApoB (Apolipoprotein B)
T3 (Triiodothyronine)
T4 (Thyroxine)
TSH (Thyroid-Stimulating Hormone)
IGF-1 (Insulin-like Growth Factor 1)
Free TEST (Free Testosterone)
Total TEST (Total Testosterone)
DHEA (Dehydroepiandrosterone)
E2 (Estradiol)
VitD (Vitamin D3)
To see both your Performance and Health data points improve over time means you are on the right track!